Fighting Injustice Is Every Educator’s Obligation

Art36-BlackLivesMatter.jpg

Ahmaud Arbery was gunned down simply for jogging, and those who were videotaped killing him remained free for an unconscionable amount of time. George Floyd was arrested for using – possibly unknowingly – a counterfeit $20 bill and pleaded with police to please lift the knee from his neck until an officer killed him.


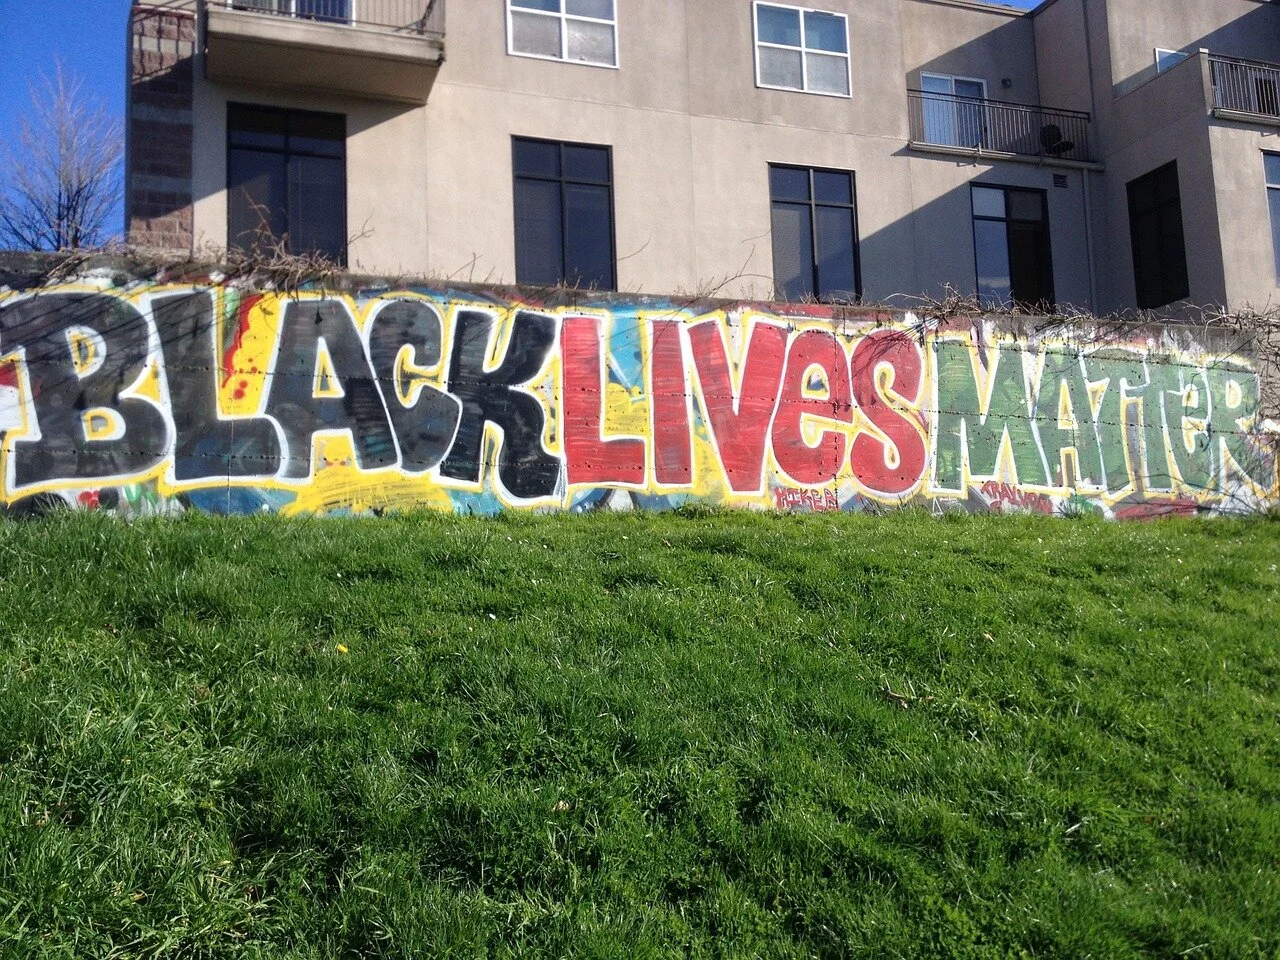
These are recent stories in the news, but they are not isolated events. They are part of a long history of racism in this country, including its systems and institutions. The #BlackLivesMatter movement persists because racism is an ongoing, deeply rooted problem. The #MeToo movement persists because sexism is an ongoing, deeply rooted problem. The #Pride movement persists because discrimination against the LGBT+ community is an ongoing, deeply rooted problem. Even when the media turns its attention to a new topic, the prejudices in our country, our communities, and ourselves do not go away.


This presents all educators with an opportunity. Children in our country are touched by educators at some point in their lives, typically during key developmental stages and typically for many years. Educators have access to all lives and are thus in prime position to shape our country’s future adults and society. It is clear that what we are currently doing as a field is not enough, because every life lost or tread upon is one too many. Following are seven convictions to expand whatever you are currently doing to fight injustice, followed by encouragement to read and hear from the many voices that have much to add to this dialogue.


Recognize that bias is inherent in your brain. Bias is a fundamental component of behavioral economics, which is essentially your brain’s attempt to be more efficient (see Kahneman, 2011; Rankin, 2019). If you do not accept that you have biases, you cannot identify them and put them in check when they encourage a conclusion based on someone’s appearance or lifestyle.


Recognize where you come from a place of privilege. Privilege (being born from a group less likely to experience microaggressions and injustices; for example, being born White, male, heterosexual, and/or financially advantaged) greatly impacts your experiences. If you are not consistently aware of how privilege impacts your perspective, you cannot identify this influence to catch what might otherwise be a blind spot or an unjust conclusion. For example, as I write this I am perpetually aware that as a White person I do not have some of the experiences that would give me a deeper understanding of this article’s topic, so I continue to read and listen to the works and guidance shared by People of Color and the LGBT+ community in a very careful attempt to do the topic justice, and I make clear in the conclusion that readers should read the works of others on this topic, particularly those of people from groups experiencing discrimination. In being aware of our areas of privilege, we must also be willing to listen and to give up our advantages for a more equitable playing field.


Recognize instances of inequity in your classroom and school. Institutional racism can only be corrected if we each recognize our own roles in the problem. For example, Black students are approximately half as likely as White students to be labeled gifted, even when their test scores are comparable (Grissom & Redding, 2016; Rankin, 2016). This does not mean fewer Black students are gifted; rather, it means thousands of Black students who are indeed gifted are not being recognized by their schools as gifted. This means these students are being robbed of the differentiated educational experiences gifted students require, which in turn impacts these students’ futures. Whatever inequity you find, be tenacious in finding and implementing solutions. For example, universal testing is an example of one change schools should implement that leads to more equitable assessment of students for gifted programs.


Recognize opportunities to close equity gaps and connection gaps in your classroom and school. Do not assume merely because you believe in helping all students that you are automatically equipped to help all students. Teacher preparation and administrator preparation programs do not always adequately arm educators with the best strategies for understanding and connecting with students whose cultures, backgrounds, or experiences differ from theirs, and (even when they do) educators should continually be expanding their skillsets in this area. Books like Yes, You Can!: Advice for Teachers Who Want a Great Start and a Great Finish With Their Students of Color (Thompson & Thompson, 2014), Gender Diversity and LGBTQ Inclusion in K-12 Schools: A Guide to Supporting Students, Changing Lives (Chappell, Ketchum, & Richardson, 2018), and Student Engagement in Higher Education: Theoretical Perspectives and Practical Approaches for Diverse Populations (Quaye & Harper, 2015) should be a fundamental component of every educator’s reading list.


Recognize injustice is not a fluctuating issue. When a racist incident hits the front pages or when news stations all cover the same sexual harassment suit, injustices move farther to the forefronts of people’s minds. But such issues do not disappear when different stories command the media’s attention. When we educators only speak of injustice when it’s the news of the day, we show ourselves to be out of touch with the ongoing slights and hatred people face on a daily basis due only to their race, ethnicity, gender, sexual orientation, or other natural aspect. For example, if a classroom teacher only talks about racism when it’s Martin Luther King Jr. Day, even though racism (in the form of microaggressions, denied opportunities, outright hatred, or any other manifestation) touches her students every day, then she sends damaging messages to some students about her (and the world’s) care for them, taints her ability to connect with them, fails to affirm some students’ experiences while instead affirming an ignorant mindset, fails to help all students manage their biases in ways that will mold a better future, and more. If we are out of touch with such a massive issue on a daily basis, then we are not doing all we can to rectify it.


Recognize that inequity touches every education topic. Every educator has a specialty: maybe a teacher is big on cooperative learning, or a researcher studies collaboration between school administrators. Whatever you perceive as your specific area of expertise, recognize the ways in which inequity touches your topic. Only then can you regularly integrate those factors into your studies and integrate solutions into your practices and what you share with others. For example, when I give conference keynotes on engaging gifted students, I first share data on ways in which some students are excluded from gifted programs on the basis of race, gender, or socio-economic status (and I also share solutions). Only by addressing inequity am I able to truly be speaking about how to engage all gifted students. We cannot view gender as something only transgender and women should be talking about, race as something only People of Color should be talking about, etc. That said…


Recognize opportunities to amplify others’ voices. The same groups who continually face discrimination in our society also face discrimination in our field, and their vital voices are missing from field dialogue (see Rankin, 2018 & 2019 for more resources). Thus, it is important to continually be looking around and asking, “Who should be at this table but isn’t? Who should be speaking on that panel but isn’t?” etc., and to speak up to promote missing voices. For example, CES is the largest technology convention in the world (and one many education and edtech experts attend). When CES was called out by Gender Avenger for featuring zero women in its extensive keynote lineups for both its current and upcoming years (Captain, 2017), CES added five women to its next keynote speaker lineup. As another example, I tweet and post on social media the works of People of Color writing about racism far more than I tweet or post about my own works on the topic, use this blog column as a place to interview others, constantly recommend qualified experts for opportunities and platforms, etc. Ask which voices need to be heard, and never stop promoting diversity of voices in our field.


A single article or series cannot provide everything there is to know about stopping inequity and prejudice in our world. However, I hope this article is but one piece of many that you read (and that you give works by People of Color, women, and LGBT+ community members on this topic priority) as you continually strive to learn more about injustice and what you can do to fight it.

References

Captain, S. (2017, December 4). CES slammed for not including any female keynote speakers this year. Fast Company. Retrieved from www.fastcompany.com/40503227/ces-slammed-for-not-including-any-female-keynote-speakers-this-year

Chappell, S. V., Ketchum, K. E., & Richardson, L. (2018). Gender diversity and LGBTQ inclusion in K-12 schools: A guide to supporting students, changing lives. New York, NY: Routledge.

Kahneman, D. (2011). Thinking, fast and slow. New York, NY: Farrar, Straus and Giroux.

Quaye, S. J., & Harper, S. H. (2015). Student Engagement in Higher Education: Theoretical Perspectives and Practical Approaches for Diverse Populations. New York, NY: Routledge.

Rankin, J. G. (2016, August 10). Gifted programs’ embarrassing secret: Changes are needed to achieve fair inclusion. Psychology Today. Retrieved from www.psychologytoday.com/blog/much-more-common-core/201608/gifted-programs-embarrassing-secret

Rankin, J. G. (2018, April 2). Educators battle discrimination in the field: Part 1: Obstacles in higher education. Psychology Today. Retrieved from www.psychologytoday.com/us/blog/much-more-common-core/201804/educators-battle-discrimination-in-the-field

Rankin, J. G. (2019, February 6). Researchers battle discrimination, Part 1: Higher education. Psychology Today. Retrieved from www.psychologytoday.com/blog/much-more-common-core/201902/researchers-battle-discrimination-part-1-higher-education

Rankin, J. G. (2019, December). Behavioral economics of the mind on design: Identity, bias, and more. She Ji: The Journal of Design, Economics, and Innovation, 5(4), 376–379. doi: https://doi.org/10.1016/j.sheji.2019.11.010 

Thompson, G. L., & Thompson, R. (2014). Yes, you can!: Advice for teachers who want a great start and a great finish with their students of color. Thousand Oaks, CA: Corwin.

New Book (Free Sneak Peek): Increasing the Impact of Your Research

Dr. Jenny Grant Rankin's 11th book, Increasing the Impact of Your Research: A Practical Guide to Sharing Your Findings and Widening Your Reach, is being published by Routledge/Taylor & Francis (available May, 2020). This important resource helps researchers in all disciplines share their findings, knowledge, and ideas effectively and beyond their own field. By pursuing the practical recommendations in this book, researchers can increase the exposure of their ideas, connect with wider audiences in powerful ways, and ensure their work has a true impact.

Read more

INFOGRAPHIC: Easy Ways to Share Your Ed Expertise with the World

This infographic shares some of the many practical strategies from the book Sharing Your Education Expertise with the World: Make Research Resonate and Widen Your Impact:

The strategies featured are:

Let Reporters Come to You

 Register with these sources journalists search for experts:

Download Lists of 2,000 Opportunities

 Click “eResources” tab after visiting goo.gl/qNWR2g.

Author a Book… with 1 Chapter

 Clean up a college paper, visit IGI Global (www.igi-global.com/publish/call-for-papers), change “Display” field to “Call for Book Chapters”, & submit. Once published, you'll be a published author, can set up an Amazon author page (among others), & will look desirable on future book proposals.

Bookmark This

goo.gl/fBhun7 (scan it for reporters’ invitations).

Add #TellEWA When Tweeting Your Work

 The Education Writers Association (EWA) will often share your piece with its 3,000+ journalists as an “EWA Story of the Week”.

Present Online as Step to Give TED Talk

Sort the list of conferences (see 4 tips above) by location & speak at one listed as “online”. You can present in your pajamas (attendees only see your slides) while using notes (sound like a genius!). Save your recording’s weblink & use it when your TED Talk (www.ted.com) application requires a recored sample of your public speaking.

Learn more in the book Sharing Your Education Expertise with the World: Make Research Resonate and Widen Your Impact by Jenny Grant Rankin, Ph.D.

Your ideas (& you!) are worth it!

NEW BOOK: Engaging & Challenging Gifted Students: Tips for Supporting Extraordinary Minds in Your Classroom

Though nearly 5 million students can be characterized as gifted and talented in the United States, many exceptional learners "fly under the radar." Because those who slip through the cracks are not appropriately challenged in the general classroom, they never meet their full potential in school or in life.

Engaging & Challenging Gifted Students: Tips for Supporting Extraordinary Minds in Your Classroom, just published by ASCD, can help. Author Jenny Grant Rankin, Ph.D., equips general classroom teachers with the information and strategies they need to spot, advocate for, engage, and challenge exceptional learners in their classrooms.

Learn how to:

·       recognize the challenges of each child,

·       identify the five unexpected traits of exceptional learners, and

·       adjust your teaching to meet the needs of all learners.

Filled with useful strategies and poignant personal accounts, this book gives you the "meat" of what you need to prevent those students who need to be challenged and engaged from slipping through the cracks.

About the Author

Jenny Grant Rankin, Ph.D., teaches the Post Doc Masterclass at the University of Cambridge. Dr. Rankin, who resides in California most of the year, earned a Ph.D. in Education, with a specialization in School Improvement Leadership. She is an award-winning former junior high school teacher who earned such honors as being named Teacher of the Year and having the American flag flown over the US Capitol building in honor of her dedication to her students. As the majority of her students were socioeconomically disadvantaged English learners, she specialized in using data, differentiation, and creative instruction (e.g., gamification, project-based learning, global learning) to ensure that her exceptional students were being challenged and engaged even as they learned alongside struggling and grade-level learners. Dr. Rankin, a Mensan who grew up in GT/GATE/TAG, is the assistant coordinator of her county's Mensa Gifted Youth Program and the author of numerous books and journal articles.

Book Details

Paperback: 64 pages

Publisher: ASCD (October 14, 2016)

Language: English

ISBN-10: 1416623345

ISBN-13: 978-1416623342


NEW BOOK: First Aid for Teacher Burnout: How You Can Find Peace and Success

Offering clear strategies rooted in research and expert recommendations, First Aid for Teacher Burnout, by Dr. Jenny Grant Rankin, empowers teachers to prevent and recover from burnout while finding success at work. Each chapter explores a different common cause of teacher burnout and provides takeaway strategies and realistic tips. Chapter coverage includes fighting low morale, diminishing stress, streamlining grading, reducing workload, leveraging collaboration, avoiding monotony, using technology to your advantage, managing classroom behavior, advocating for support from your administration, securing the help of parents and community, and more. Full of reflection exercises, confessions from real teachers, and veteran teacher tips, this accessible book provides easy-to-implement steps for alleviating burnout problems so you can enjoy peace and success in your teaching.


Reviews

This one’s a must-read. In my 22 years of teaching, I have read a lot of books about how to be more effective, how to help my students be more successful, and how to improve the culture and the climate of my school. Rankin’s book, however, stands alone. It is a must-read for teachers, administrators, and anyone else who is interested in understanding the profession and helping to make it a sustainable career choice.

It is the only book I’ve seen that is written with the goals of doing all of those things through helping teachers. Reading it truly felt like a gift. Without hesitation, I recommend First Aid for Teacher Burnout: How You Can Find Peace and Success to anyone who needs a shot in the arm to decrease or continue to avoid teacher burnout.

Read the rest of this wonderful review at https://www.middleweb.com/34956/first-aid-for-teacher-burnout-a-must-read/

—Rita Platt, MiddleWeb: Book Reviews

"This book is organized in such a way that teachers who are already cramped for time can turn to just the part of the book that applies to them, and quickly find practical tips that can make an immediate difference in their careers. I absolutely recommend it to teachers who are struggling to manage their careers right now!"

--Elizabeth Simpson, Math Coach, The Lamphere Schools, MI

"There is a drastic need for this book. As a veteran teacher, I am friends with the older teachers and a mentor to the new ones. I know all of us could use a little ‘first-aid’ and will appreciate the strategies in this book!"

--Cristie Whitley Watson, 6th Grade ELA teacher, Gravelly Hill Middle School, NC

"First Aid for Teacher Burnout is just that: a book that helps you with the bumps and scrapes that happen for all teachers during the course of their career. With this book you have a guide to prevent the long term illness that is "burn out" and build a THRIVING career. I cannot wait to have all my teacher friends read this book and continue to do the work they love: Guiding our next generation of leaders."

--The Teaching Well, a teacher health and sustainability organization

About the Author

Jenny Grant Rankin, Ph.D., teaches the PostDoc Masterclass at University of Cambridge. She is a former junior high school teacher and administrator who won "Teacher of the Year" and has been honored by the White House for her dedication to students.


Book Details

Paperback: 214 pages

Publisher: Routledge/Taylor & Francis (September, 2016)

Language: English

ISBN-10: 1138655473

ISBN-13: 978-1138655478


Visit www.jennyrankin.com/subscribe to subscribe to this blog.

Source: https://www.amazon.com/First-Aid-Teacher-B...

Data Reporting/Use Research Shined at AERA & NCME

I recently returned from attending and presenting at this year’s American Educational Research Association (AERA) Annual Meeting and National Council on Measurement in Education (NCME) Annual Meeting, which were held in conjunction in Washington, DC. A wealth of important research was shared at these conferences. Below I have listed important papers that contributed to dialogue concerning making data work for educators and other education stakeholders.

Access to these papers, in their entirety, will eventually be featured online. I’ve thus included links that can lead you to the complete papers once AERA and NCME post them in their respective online paper repositories. Here are categorized lists to put the work on your radar in the meantime.


Improved Design of Data Reports


The following papers were shared within an NCME session chaired by April Zenisky titled Thinking About Your Audience in Designing and Evaluating Score Reports:

Designing and Evaluating Score Reports for a Medical Licensing Examination by Amanda Clauser and Francis Rick

Evaluating Validity of Score Reports with Diverse Subgroups of Parents by Priya Kannan, Diego Zapata-Rivera, and Emily Leibowitz

Designing Alternate Assessment Score Reports: Implications for Instructional Planning by Amy Clark, Meagan Karvonen, and Neal Kingston

Interactive Score Reports:  a Strategic and Systematic Approach to Development by Richard Tannenbaum, Priya Kannan, Emily Leibowitz, Ikkyu Choi, and Spyridon Papageorgiou

Data Systems and Reports as Active Participants in Data Analyses by Jenny Rankin


Improved Data Use


The following paper was shared within an AERA session titled Continuous Improvement Reforms for Student Achievement: Implementation and Impacts:

Professional Learning for Student-Involved Data Use by Jo Beth Jimerson, Vincent Cho, and Jeff Wayman


The following papers were shared within an AERA session titled Advancing the Practice of Using Assessment Data for Instructional Improvements in K-12 Settings:

Designing Rubrics to Assess Information Literacy Skills in Naturalistic Classroom Settings in Hong Kong by Yeung Lee

Do Schools in Challenging and More Advantageous Circumstances Differ in Terms of Data Use? by Denise Demski, Isabell Van Ackeren, and Kathrin Racherbäumer

Data Literacy: Are Teachers Prepared? by Whitney Elaine Wall Bortz and Jeananne Knies

Learning-Centered Leadership: An Evidence-Based Pedagogical Synergy Model for Promoting Data Use in High Schools by Sigal Reinders Kafri and Haggai Kupermintz

Making Data "Over-the-Counter" Helps Educators Understand Data by Jenny Rankin

Formative Assessment in the Age of Accountability: Practitioner Perspectives on a Statewide Kindergarten Entry Assessment by Angela Ferrara, Richard G. Lambert, Pamela L. Shue, Priscila G. Baddouh, and Monique Nicoleau


Data Visualization


These papers were shared within a session titled Learning with Static and Dynamic Visualizations:

Construction Knowledge From Interactive Visualizations: How Comprehension of Complex Relations Influences Representational Choice by Ulrich Ludewig, Erica de Vries, Neil H. Schwartz, Neil Garrett Jacobson, Amy Rae Fox, and Savannah Loker

Separated and Integrated Formats of Information Presentation in Multimedia Learning and the Expertise Reversal Effect by Joerg Zumbach, Stephanie Moser, and Ines Deibl


All papers listed here can help to inform making data “over-the-counter” (meaning easy to understand and use) for educators. Many thanks to AERA and NCME for offering venues where educators and researchers can contribute to the dialogue of improved education data reporting and data use.


Visit www.jennyrankin.com/subscribe to subscribe to this blog.


NEW BOOK: Standards for Reporting Data to Educators

It has been a busy couple of months. The third book in a 3-book collection published by Routledge/Taylor & Francis was just released today, offering readers the chance to read the book(s) that speaks directly to their particular job duties and interests related to education data. Standards for Reporting Data to Educators: What Educational Leaders Should Know and Demand summarizes over 300 studies and other expert sources concerning how data should best be displayed for educators, so that busy educators can quickly and easily understand data they use to inform decision-making. This book is for people who want to examine the actual research behind two other books on the same topic, released earlier this month and last month: 

  • Designing Data Reports that Work: A Guide for Creating Data Systems in Schools and Districts (this book is for anyone who designs data visualization, data reports, or data systems to be used by educators or education stakeholders; readers might be educators who extract data from a data system to produce data displays to be read by others, educational technology vendors who provide data systems or data reports to educator clients, other organization representatives who support educators with data, etc.)

Thus the same topic is approached for all stakeholders who play central roles in effective data use, with a book catered to each: educators, data providers, and researchers. I am very grateful for the following endorsements, from two of the most prominent and prolific experts in the field:

"Too often, teachers are handed data that are inscrutable or easily misinterpreted. In Standards for Reporting Data to Educators, Dr. Rankin provides solid recommendations that will not only save teachers time, but also improve their knowledge about students."

- Vincent Cho, Assistant Professor of Educational Leadership and Higher Education, Lynch School of Education, Boston College

"The ways that data are presented make such a difference in how educators understand and use data. In Standards for Reporting Data to Educators, Dr. Jenny Rankin uses research to identify best practices in presenting data to educators. The result is a clear, research-based framework that will be an important aid to anyone interested in educator data use."

- Jeffrey C. Wayman, Ph.D., Wayman Services, LLC

Standards for Reporting Data to Educators: What Educational Leaders Should Know and Demand is available now in hardcover and Kindle. I hope those of you who read it (or merely use it as a reference) enjoy it. Thank you to all who help to improve data displays and support so busy educators can more easily understand and meet students’ needs. Given the many demands placed on educators’ time, data use should be simple so educators can focus on what they do best: changing students’ lives.


Visit www.jennyrankin.com/subscribe to subscribe to this blog.

NEW BOOK: Designing Data Reports that Work

How to Make Data Reports that Work: A Guide for Creating Data Systems in Schools and Districts, published by Routledge/Taylor & Francis, provides research-based guidance to anyone who designs data visualization, data reports, or data systems to be used by educators or education stakeholders. Readers might be educators (such as those who extract data from a data system to produce data displays to be read by others), educational technology vendors (who provide data systems or data reports to educator clients), or other organizations that support educators with data. Those providing high stakes data in other fields can also benefit.


This helpful guide offers clear examples and explanations for how to best present data in ways that actively facilitate accurate interpretation of data, helping educators to avoid common errors and pitfalls. The book provides clear strategies for getting data into workable shape that supports understanding, analysis, and successful use of data so data becomes easy to use (and so that other efforts to improve data use – such as effective data use climate and professional development – are not undermined by cumbersome data presentation). The book is a companion to How to Make Data Work: A Guide for Educational Leaders, which supports educators leading data use at their schools or districts, but reading either book alone is effective.


Though written by Dr. Jenny Grant Rankin, the book also features vignettes written by some of the field’s most knowledgeable data experts in the field of education. These expert contributors include:


I am very grateful for these contributions, as well as for the following expert endorsements:


"Too often working with education data is a solo and DIY effort. Dr. Rankin has synthesized best practices from hundreds of experts in the field to provide a go-to resource."

- Leo Bialis-White, Vice President of Impact, Schoolzilla


"Dr. Rankin's pragmatic approach to data systems and reporting design will shorten your engineering cycles and put relevant, usable data in the hands of your customers. This book is a must-read for anyone who wants to go beyond data warehousing and create something that can truly raise the game of teachers and the students they teach."

-Rudi Lewis, Chief Operating Officer, Silverback Learning Solutions


"The standards covered in this book revolutionized our edtech data system and data reports. This book is the leading source for anyone who wants to share education data effectively."

- Lane D. Rankin, CEO/President/Founder, Illuminate Education


"As someone who worked on data at the school district level on a daily basis for many years, a book like this would have saved me a lot of time."

- Rufus Thompson, Illuminate Education and Formerly the Technology Coordinator for Mountain View School District, Ontario, California


"This book is comprehensive, thoughtful, specific, and ahead of its time when it comes to data-driven instruction best practices. Anyone who follows these standards is certainly on a path to achieve successful outcomes."

- Ryan Winter, President, LinkIt!


This book is available now in paperback, hardcover, and Kindle. I hope those of you who read it enjoy it. Thank you to all who provide research-based data displays to help educators better understand and meet students’ needs, and thank you to all who believe in making data use easier for busy educators.


Visit www.jennyrankin.com/subscribe to subscribe to this blog.

New Book: How to Make Data Work

This helpful guide, published by Routledge/Taylor & Francis, provides educational leaders with simple steps for facilitating accurate interpretation of data, while avoiding common errors and pitfalls. How to Make Data Work: A Guide for Educational Leaders provides clear strategies for getting data into workable shape and creating an environment that supports understanding, analysis, and successful use of data, no matter what data system or educational technology tools are in place in your district.

Though written by Dr. Jenny Grant Rankin, the book also features vignettes written by some of the field’s most knowledgeable data users. These expert contributors include:

  • Kris Boneman of Bonita Unified School District
  • Carol Bright of Buena Park School District
  • Dr. Sharon Cordes of Tustin Unified School District
  • George Knights of Newport-Mesa Unified School District
  • Michael Morrison of Laguna Beach Unified School District

I am very grateful for these contributions, as well as for the following experts in the field who offered these endorsements:

  • "This book bridges the divide between research and typical data reporting, showing education leaders practical ways to make data digestible for staff."

- Debra L. Diaz, Former Principal, Charles G. Emery Elementary School

  • "Dr. Rankin's book is a game-changer. This book doesn't just repeat data use strategies we've all heard and tried – it fundamentally simplifies how data use works."

- Gustavo Reyes, School Administrator, Ramón C. Cortines School of Visual and Performing Arts

  • "Finally, someone is talking about the missing piece in data use. I learned most education data is misunderstood, I learned why, and I learned exactly what to do about it."

- Jennifer Kagy, Teacher and Technology Coordinator, Schmitt Elementary School

  • "This work completely changed how colleagues and I look at data. Scores and other data that used to dishearten us are now exciting and easy to understand."

- Julie Duddridge, Lead Teacher and Teacher Mentor/Support Provider, Lincoln Elementary School

  • "The standards we've implemented from this book have helped us create a common language about the data and build capacity throughout the district to ensure the data is used appropriately for making informed decisions that lead to increased student achievement."

- Dr. Margie L. Johnson, Business Intelligence Coordinator, Metropolitan Nashville Public Schools

  • "As someone who worked on data at the school district level on a daily basis for many years, a book like this would have saved me a lot of time."

- Rufus Thompson, Formerly the Technology Coordinator for Mountain View School District in Ontario

This book is available now in paperback, hardcover, and Kindle. I hope those of you who read it enjoy it. Thank you to all who use data to better understand and meet students’ needs, and thank you to all who believe in making data use easier for busy educators.

Note: This book has a companion book written for data system vendors and educators who create their own data reports. Designing Data Reports that Work: A Guide for Creating Data Systems in Schools and Districts will be available in approximately one month.


Visit www.jennyrankin.com/subscribe to subscribe to this blog.

TED Talk at TEDxTUM Shares Education Data Research

I had the honor of presenting my research at TEDxTUM in a TED Talk called “Why Data Should Be Over-the-Counter.” The talk relates to any field where high-stakes data is communicated and used, yet the research was conducted specifically for educators. I hope you enjoy the talk: https://www.youtube.com/watch?v=36186S-RsKY.

I owe much thanks to Dr. Danny Slomoff, of Slomoff Consulting Group Inc., who lent me his superb speech coaching skills to prepare me for the talk. I am also full of gratitude for the TEDxTUM organizers, who provided helpful suggestions at each rehearsal and made my visit to Munich forever memorable. In particular I thank Mohamed Mohie, Thomas Schönberger, Alba Xhani, and Dora Dzvonyar. These great minds have so much to offer the world.

Visit www.jennyrankin.com/subscribe to subscribe to this blog.

96


Normal
0


false
false
false

EN-US
JA
X-NONE


 <w:LatentStyles DefLockedState="false" DefUnhideWhenUsed="false"
DefSemiHidden="false" DefQFormat="false" DefPriority="99"
LatentStyleCount="38…

Photo by Alexander Brandt alexander-brandt.com

South Dakota SLDS Integrates Research for Improved Data Use

South Dakota has emerged as a leader in applying over-the-counter data (OTCD) research and standards to its statewide longitudinal data system (SLDS), known as Student Teacher Accountability and Reporting System (STARS). SD-STARS consolidates and integrates data available to the South Dakota Department of Education (SDDE), such as assessments, finances, personnel and certification records, student information system (SIS) data, and more.  SD-STARS facilitates education stakeholders’ analysis and use of this data to improve instruction and student performance.


State departments of education offering high-quality longitudinal data systems doubled in 2010 and were expected to be complete in all states by the end of 2011 (Herbert, 2011). While these education data systems provide educators with data, they have traditionally done so without adequate support to use that data correctly. This has applied:

  • whether the data systems are provided at the state, county, or district level, and
  • whether the data systems are built and maintained locally (in-house) or by an outside agency (vendor)


SDDE is a clear exception to that rule. SDDE officials actively researched best practices for reporting education data, so that data reports are accompanied by clear guidelines on how to understand and use the data. Metro Nashville Public Schools (MNPS) and its guide use was one source of inspiration. As far back as 2013, SDDE utilized OTCD research concerning the use of interpretation guides (also called reference guides) and used guide templates modeled after those shown to be significantly effective. The quantitative study on which these templates were modeled involved 211 educators of varied roles and backgrounds and produced evidence educators’ data analysis accuracy improved by 436% (i.e., more than quadrupled) when the guides were used.


SDDE’s data interpretation guides – or DIGs – offer all of the guide components shown to be successful. Each DIG features an image of the particular data report to which the guide is tailored, and contains the following report-specific sections:

  • Quick Reference (Description, Questions Report will Help Answer, Intended Audience, Data Details, Common Misunderstandings/Warning)
  • Instructions (Generating Report, Reading Report, Downloading)
  • Essential Questions (e.g., how to use the report to help answer key questions)
  • Frequently Asked Questions
  • Report Details (History, Report Responsiveness, Problems?)
  • Security (Roles with Report Access, Security Consideration)


These guides help to ensure those who use SD-STARS reports don’t achieve the mere 11% to 48% accuracy studies suggest is typical of educators’ inferences concerning data they view in ordinary data reporting environments. Rather, these guides can more than quadruple that accuracy so stakeholders can truly use data to improve instruction and student success.


Yet SDDE did not stop with guides. They also provide other supports to help educators use the SD-STARS data successfully. For example, they offer:


The step-by-step, targeted lessons SDDE provides are in line with the OTCD help system standards. There is much support for resources, such as evidence that a shorter, targeted manual or user-friendly help system causes users to need 40% less training time and to successfully complete 50% more tasks than they would have accomplished with only access to a full-sized manual.


As the Data Quality Campaign (DQC) (2011) asserts, the power of statewide data systems will not be realized until education analysts and researchers – as opposed to just information technology staff – are involved in the full scope of the systems’ design. Applying research on best practices for education data reporting is paramount. SDDE is an example from which other states can learn as they work to make their SLDSs not just warehouses of data, but true resources for improving learning.


Visit www.jennyrankin.com/subscribe to subscribe to this blog.

Common Assessments Lead to Easier and Better Data Use

Blog090114-CommonAssess.jpg

As schools across the nation transition to assessments tied to Common Core State Standards (CCSS), the focus has been – understandably – on steps leading up to each test's administration. Nonetheless, a look at what will likely happen after the assessments are administered can bring relief to educators familiar with the challenges of performance data use.


Currently, there is much evidence educators often analyze data incorrectly, despite above-average intellect, professional development, and varied district supports. Though many explanations exist, the manner in which data is displayed for educators has proven to be a significant part of the problem.  Most teachers, principals, and other stakeholders have viewed a data report and thought, “This shouldn’t be so hard to understand.” They are right. Educators constitute ideal consumers of data given their higher-than-average schooling, intellect, and care for the jobs they do. If data is misunderstood by such consumers, that data needs to be made easier to understand.


The data systems and reports that communicate data to educators can do much to improve the use of assessment results if they present data in an “over-the-counter” format, which means data is made easier for educators to understand and use. This involves good design practices applicable to all data reports, as well as offering embedded data analysis guidance. When educators are using different assessments, it becomes harder for data system/report providers (DSRPs) to offer the best displays and supports each assessment warrants.


Label


According to a quantitative study of 211 educators of varied backgrounds, adding a label (with report-specific/assessment-specific data analysis guidance) to a report renders educators’ data analyses 307% more accurate (Rankin, 2013). This involves a footer or other annotation of 1-3 lines of text, placed directly on the data report to help educators understand its specific data and avoid common analysis errors.

Each data report’s label should be catered specifically to the data being reported. When educators utilize unique state assessments, in addition to diverse local assessments, DSRPs are less likely to provide customized labels to support correct analyses of these assessments’ results. Now that Smarter Balanced Assessment Consortium (SBAC) or Partnership for Assessment of Readiness for College and Careers (PARCC) assessments are being used in most states (with California using the former), with many educators also using related interim resources, more of educators’ data reports will feature the same types of data. DSRPs can then more easily provide labels to support the proper use of these common assessments’ results.


Supplemental Documentation


According to the same study, educators’ data analyses are 205% more accurate if a reference sheet accompanies the report or 273% more accurate if a reference guide accompanies the report. Research-based templates (www.jennyrankin.com/templates) can be used to create effective reference sheets and guides, which help educators understand and use a specific report.


Creating supplemental documentation takes more time than writing a brief report footer. Thus the standardization of state assessments is especially important to helping DSRPs offer supplemental documentation more frequently and successfully. Effective supplemental documentation reflects a keen understanding of the data being reported. The widespread use of SBAC and PARCC assessments increases the likelihood of DSRPs being familiar with these assessments and the guidelines for interpreting their results. Such familiarity will better facilitate quality supplemental documentation in data systems and report suites.


Help System


According to van der Meij (2008), shorter, targeted manual or user-friendly Help system causes users to need 40% less training time and to successfully complete 50% more tasks than they would have accomplished with only access to a full-sized manual. An edtech data system can feature a help system with task-based lessons on how to use the technology, but also with topic-based lessons to help educators use the data displayed by the technology.


For example, imagine the first time a teacher tries to use SBAC interim assessment results in a formative way. He or she could have questions like:

  • Using these results as one of multiple measures, how can I now group my students for differentiated intervention, how can I determine how to personalize their learning, and where can I find interventions appropriate to each student?
  • How can I use this assessment as part of a year-long assessment plan?
  • What basics should I know if I am new to using data?


Other resources, such as CCSS websites, might provide some answers to some of these questions. However, those answers are scattered. A help system can offer a centralized location for lessons addressing each of the teacher’s key needs, right where the teacher already is: in the data system.


A U.S. Department of Education (2009) study found 59% of teachers report using data systems on their own time. This increases the need for a help system to serve as a virtual data coach. Now that most states will be assessing students’ mastery of CCSS, DSRPs can use CCSS-based examples in help lessons to make content more familiar to educators and more applicable to their undertakings.


Package/Display


Common assessments make it easier (and thus more likely) for DSRPs to tailor a report’s display – or the way its data is ‘packaged’ – to the assessment’s reporting needs. For example, since graphing all of an assessment’s results minimizes the benefits of using graphs, a DSRP familiar with an assessment would be more likely to know which data to graph, as well as which graph types and features best facilitate understanding of the particular assessment’s data. For educators, well-designed data reports foster improved understanding and use of the data being displayed.


Content


Each report’s content should be selected based on what will make the assessment results easiest to understand and use appropriately. For example, changing legislation related to the assessment data can warrant changes to table headers (such as new demographic labels), changes to graphs (such as how proficiency status is determined and shown), changes to calculations (such as how the assessments are factored into federal accountability for school districts), and more. Thus the more familiar DSRPs are with an assessment, the more likely they are to know when content ‘expires’ and needs to be replaced. Likewise, this familiarity can help DSRPs craft report content most helpful to each report’s audience.


A Hope


Presently, most data systems do not present data in an over-the-counter (i.e., easy to understand and use) format. Given the varied assessments used state-to-state, the varied home states of DSRP vendors striving to remain familiar with so many assessments, and the fact that DSRP companies are not typically staffed by educators who have used all of these varied assessments, the challenges of catering each report’s design and supports to its particular assessment are understandable.


The more common assessments become from one state to the next, the more familiar those who communicate the assessment results can become with the best way to report and support the use of the assessments’ data. The standardized, widespread nature of CCSS assessments will make it easier for data systems and reports to more actively facilitate accurate data use.


Now it is up to DSRPs (e.g., vendors) to rise to the occasion. When they do, educators will have an easier time using data successfully. This means they will have a powerful complement to all they do to help students.


Visit www.jennyrankin.com/subscribe to subscribe to this blog.

Newsworthy Resources Concerning Education Data

When it comes to following the topic of education data, varied stakeholders can hold special interest in specific sub-topics. I have organized a few recent, noteworthy resources by each common-interest category. These include: data collection & sources (for anyone collecting data or designing related instruments such as assessments), data reporting (for anyone communicating data), data privacy and Common Core Statements Standards (for anyone collecting, reporting, or using data), and data use (for educators using data).


Data Collection & Sources


Data Reporting


  • I was very impressed by Edward Tufte’s course in communicating education data, although it relates to data in any field rather than education data; he has many courses running now through April.


  • Like Tufte, Stephen Few is also an expert when it comes to communicating many types of data; his 2014 workshops begin this month.


  • Great data reporting is about understanding more than just good data visualization. Hack Design is a free course for which you can sign up to receive weekly, emailed lessons covering a wealth of other important design concepts. Thanks go to Zach Rankin for introducing me to this wonderful resource.


Data Privacy


Common Core State Standards


Data Use


  • WestEd’s Data for Decisions lists links to related research (including my own study, added 1&1/2 months ago), and there are also links to tools such as training materials.


  • Dr. Jeff Wayman is one of our generation’s leading experts in district’s use of data. His Twitter site can keep you updated on news and resources related to data use, as they are released.


Conclusion


Combined with the resources at www.overthecounterdata.com, the sources listed above can help in varied endeavors related to making the most of education data. While many people have a special interest in just one of these topics, and there is no problem with specializing, stakeholders should still remain updated on all key topics that are important (and interconnected) to effective data-related practices.


Visit www.jennyrankin.com/subscribe to subscribe to this blog.

CCNews, CERA, and Standards

A paper on how over-the-counter data (OTCD) can supplement teacher education in the area of data analysis is featured in the winter issue of CCNews (pages 14-21), the newsletter of the California Council on Teacher Education (CCTE). It is available at http://ccte.org/wp-content/pdfs-newsletters/ccte-news-2013-winter.pdf and is accompanied by other valuable information pertinent to teacher education.

A presentation on how over-the-counter data supports can be used to improve data analyses will be given tomorrow (December 5, 2013) 4:30-5:15 P.M. at the 92nd Annual California Educational Research Association (CERA) Conference in Anaheim, California. This conference is loaded with current, research-based information that can be directly applied to the practice of helping students and educators, and it is always one of the highlights of my year. More information can be found at http://cera2013.zerista.com/event/member/99068.

Both the CCNews paper and the CERA presentation relate to how following OTCD standards (when communicating education data) improves data analysis accuracy. These standards are now available in an expanded format at www.jennyrankin.com/s/OTCDStandards.pdf (rather than only the previous, abbreviated format) in order to more explicitly explain their nature. The standards reflect extensive literature and research on the topic of how best to communicate education data in order to foster optimal understanding and use.


Visit www.jennyrankin.com/subscribe to subscribe to this blog.

OTCD at K-12 Online and CCTE Conferences

A research poster on Remedying Educators’ Data Analysis Errors with Over-the-Counter Data will be featured at the California Council on Teacher Education (CCTE) Conference and presented October 25, 2013. The conference will take place at the Kona Kai Resort in San Diego, CA. The white paper on over-the-counter data (OTCD) that led to the poster’s acceptance is expected to appear in an upcoming issue of CCTE’s publication, CCNews. CCNews issues are available online and, like the conference, convey evidence that can be used to improve education at all levels.

If you can’t get down to San Diego, you can learn about OTCD from a school or district leader’s perspective at the K-12 Online Conference, which is part of Connected Educator Month (CEM). If You Want Data to Transform Learning, Present It as “Over-the-Counter” is a 1-hour, pre-recorded presentation that will be accessible anytime online between October 28 and November 1, 2013. The presentation is part of the conference’s Leading Learning strand and is intended for educators in a position to institute change on behalf of multiple staff members. The K-12 Online Conference takes place online at no cost. Conference presentations are all focused on helping educators integrate technologies into classroom practice.


Visit www.jennyrankin.com/subscribe to subscribe to this blog.

Study Results Are in: Making Data “Over-the-Counter” for Educators Significantly Improves Data Analyses

Blog092313-GraphedStudyResults.JPG

The study titled “Over-the-Counter Data’s Impact on Educators’ Data Analysis Accuracy” has concluded and the manuscript has been published by ProQuest. The findings hold significant implications for anyone involved in communicating data to educators.

Study Basics

The quantitative study was inspired by the notion that data reports should offer educators more support in analyzing the reports’ data, as when such highly educated and intelligent individuals are making data analysis errors, the tool they are using warrants improvement. Essentially, data reports should communicate more effectively and educators should not have to shoulder all the responsibility for improving their data analyses.

The researcher facilitated causal inferences concerning the degree to which including different forms of data usage guidance within a data system reporting environment can improve educators’ understanding of the data contents, much like including different forms of usage guidance with over-the-counter medication is needed to improve use of contents. The study’s primary independent variables included brief, cautionary verbiage in (a) report footers, (b) report-specific reference sheets, and (c) report-specific reference guides. These three data analysis supports (defined below), which can be generated within a data system, were each framed in 2 different formats. The dependent variable was accuracy of data analysis-based responses measured by a survey.

211 elementary and secondary educators employed at 9 schools, 6 school districts, 6 cities, and 3 counties in California generously participated. These educators answered data analysis questions while viewing 1 of 7 report sets of student data, which all featured identical data but varied levels of embedded support. The study was pilot-tested first, subscribed to all Institutional Review Board (IRB) and ethical guidelines, and reflected precautions to avoid or overcome threats to external and internal validity.

Definitions of Investigated Supports

  • Footer – brief line(s) of text (containing up to 58 words, 269 characters without spaces, and 324 characters with spaces) at the bottom of each report communicating only the most important information an educator would need to know in order to correctly understand and analyze that particular report’s data
  • Reference Sheet – a 1-page sheet (accompanying a report), often called an abstract, to communicate the report’s description, image, purpose (key questions the report will help answer), and focus (intended audience, content reported, and format in which data is reported), and warning (vital, cautionary information an educator would need to know in order to correctly understand and analyze that particular report’s data)
  • Reference Guide – a 2- or 3-page guide (accompanying a report) that looks like the reference sheet on the 1st page, but follows this with instructions (how to read the report), essential questions (walking the user through the process of specifically where to look on this report – and what to look for – to answer each question listed in the purpose area of the guide’s 1st page), and a “more info” section (such as where and how to get additional information on such topics as finding additional analysis guidance or help generating the report in the data system)

Results

All supports used in the study had a significant, positive impact on educators’ data analysis accuracy. In terms of relative difference, educators’ data analyses were:

  • 307% more accurate (with a 23 percentage point difference) when a footer was present and 336% more accurate (with a 26 percentage point difference) when respondents specifically indicated having used the footer,
  • 205% more accurate (with a 12 percentage point difference) when a reference sheet was present and 300% more accurate (with a 22 percentage point difference) when respondents specifically indicated having used the reference sheet,
  • 273% more accurate (with a 19 percentage point difference) when a reference guide was present and 436% more accurate (with a 37 percentage point difference) when respondents specifically indicated having used the guide, and
  • 264% more accurate (with an 18 percentage point difference) when any one of the three supports was present and 355% more accurate (with a 28 percentage point difference) when respondents specifically indicated having used the support.

Overall, the 211 study participants indicated they used supports 58% of the time. 87% of participants who received no supports indicated they would have used footers, reference sheet, or reference guides if the supports had been available.

When no supports were used, data analysis accuracy was 11%. In cases where respondents indicated they used an available support, data analysis accuracy was 39%. Secondary independent variables, spanning a range of educator demographics and school demographics, had no significant impact. This means educator analysis performance was generally the same regardless of educator and school demographics, and the supports were equally effective regardless of educator and school demographics.

Significance

The findings of this study filled a gap in education field literature by containing evidence that can be used to identify how data systems and data reports can help improve educators’ data analyses by providing analysis support within data systems and their reports, and by rendering examples and templates for real-world implementation. Improvements data system and report providers make in light of this study have potential to improve the accuracy with which educators analyze the data generated by their data systems. This improvement will likely benefit students.

Free templates, modeled after the supports proven effective in this study, have been added to the Resources page of this website to assist anyone interested in adding reference sheets or reference guides to his or her data system and/or to accompany his or her data reports. The footer guidelines provided in this article (above) can also assist anyone wanting to add footers to reports. The study manuscript (http://pqdtopen.proquest.com/#abstract?dispub=3575082) offers more specific details. Please note its Acknowledgements section, which offers deep gratitude to all who encouraged and participated in the study.


Visit www.jennyrankin.com/subscribe to subscribe to this blog.


Metro Nashville Shares DIDM Wisdom

The National Center for Education Statistics STATS-DC 2013 conference, a data conference that will focus on “discovering through data,” is taking place this week. Anyone interested in data-informed decision-making should attend Data-Informed Decisionmaking: It Takes a City, presented by Margie Johnson and Laura Hansen of Metropolitan Nashville Public Schools (MNPS), this Friday (July 19, 2013) in Washington, DC.

The Longitudinal Educational Analytics and Decision Support System (LEADS) MNPS created and maintains has been dubbed one of the most robust data warehouse systems in the country. Not surprisingly, Johnson and Hansen understand the importance of going beyond “just showing the data” and of taking proactive steps to ensure the data is used with ease, support, and accuracy. They will be presenting on ways MNPS uses data to support students’ education, how this involves professional learning, and an impressive data sharing approach that involves community stakeholders to increase support for students. They will be continuing the conversation afterwards via an Edmodo group (code: zt34td).

Johnson and Hansen will also be presenting on DDIM at Learning Forward’s Summer Conference 2013 (Session G09), a venue known for its professional learning value, next Wednesday (July 24, 2013). Whether you find them at STATS-DC, Edmodo, Learning Forward, or elsewhere, the Johnson and Hansen team is one to watch.


Visit www.jennyrankin.com/subscribe to subscribe to this blog.


Data Analysis in Teacher Prep

NCTQ’s Teacher Prep Review 2013 Report released this month is getting criticized for a variety of reasons, which eSchool News (Stansbury, 2013) and Education Week (Sawchuk, 2013) do a great job summarizing. Despite the report's criticisms, it is important to note an area in which NCTQ deserves praise: its inclusion of an Assessment and Data standard. By including “individual and team analysis and interpretation of data (indicator 12.3)” as one of the evaluation criteria on its Assessment and Data standard rubric, NCTQ addresses a current problem with many educator preparation programs. Consider this timeline of facts:

Now that data use is so intrinsic to educator roles, it is important educators receive adequate support in data’s analysis and use before they are acting as teachers. Having been a teacher, site administrator, and district administrator, I have seen firsthand that practicing educators juggle massive demands that would terrify and defeat the average person. With data use being one more responsibility heaped on top of their full plates, it is imperative educators receive adequate support before – as opposed to simply while – they work with students.

Nonetheless, pre-service data training does not supplant the need for data systems and reports to provide over-the-counter data (OTCD) supports when communicating data to educators, just as someone with a degree in engineering would still benefit from directions when using a new tool. Though educators without adequate data training are especially in need of the data analysis guidance OTCD standards provide when added to any data system or report, any busy educator can benefit from the added help (in support of this assertion, I look forward to posting the significant results of my quantitative study after my oral defense).


Visit www.jennyrankin.com/subscribe to subscribe to this blog.